

People frequently ask about coffeeneuring statistics. Who has coffeeneured where over the years? What is the overall number of coffeeneurs and where do they ride? How many countries are represented? Today we bring you answers to these kinds of questions.
Coffeeneur Sam Dodge (find him at @svdodge on the socials) took on the challenge of mining the data from 2021, and put together this excellent guest post that summarizes the 2021 edition of the Coffeeneuring Challenge and also looks at trends over the years. Be sure to read through to the end for his four final fun data point takeaways!
Readers and coffeeneurs, please enjoy and remember, you still have time to join the 2022 Coffeeneuring Challenge. Do it!
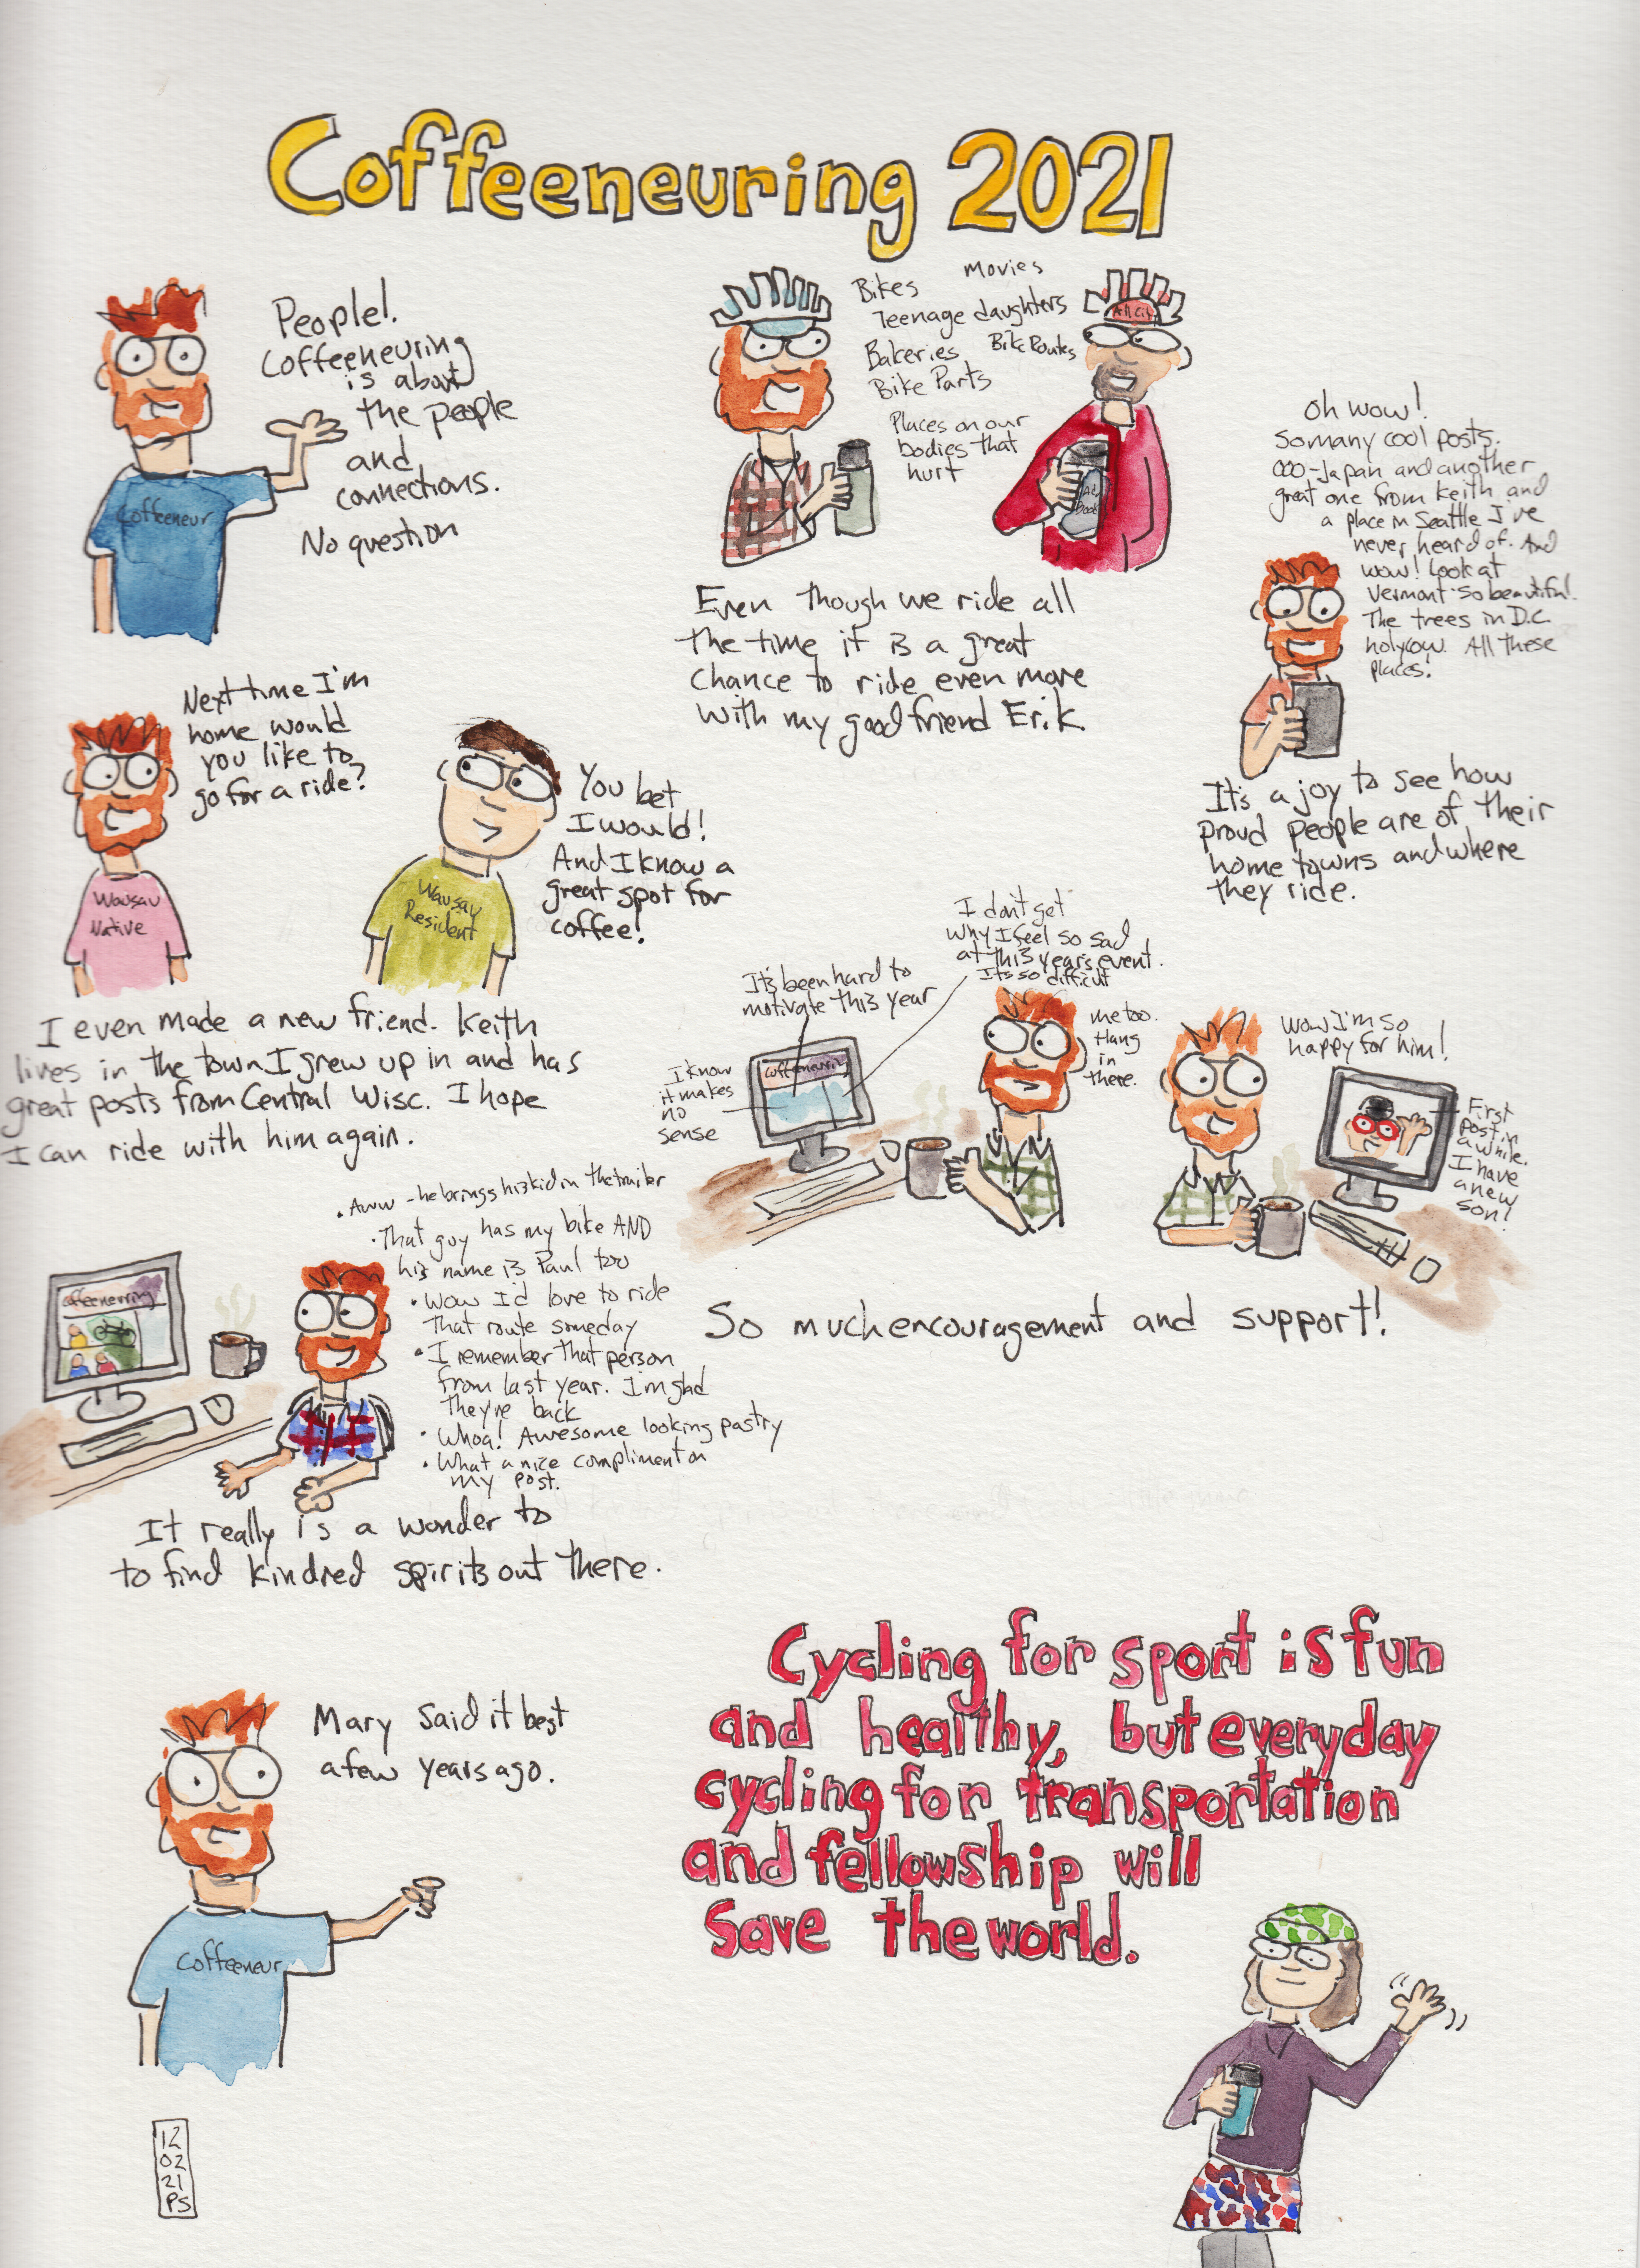
More Than a Challenge, There’s Data Too! Coffeeneuring 2021
Overall Participation in 2021
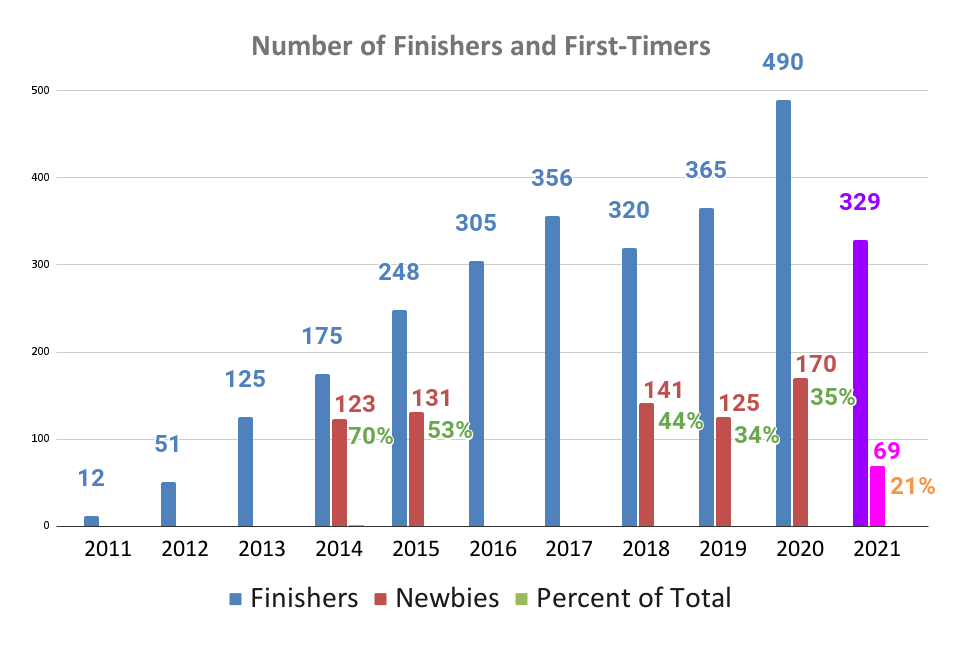
From all across this large rock we call Earth, 329 riders participated in and finished the Coffeeneuring Challenge in 2021! Of that total, 69 reported it was their first time completing the challenge (although a handful of people in this group noted they had participated before, just not completed all the trips).
Participant Trends
If we look at the trend chart we can see a pretty big drop in participants from last year back to something more in line with years previous. I suspect that the extra boost of people in 2020 was from a COVID “I really must get out of the house” effect (I know it was a factor for me!).
I gathered the numbers of first-time riders for years that I could and added them (see the red bars) along with the percent those newbies were of the total that year. Again there is a dip in 2021, but routinely seeing about 35% new riders is pretty cool!
Finisher Streaks
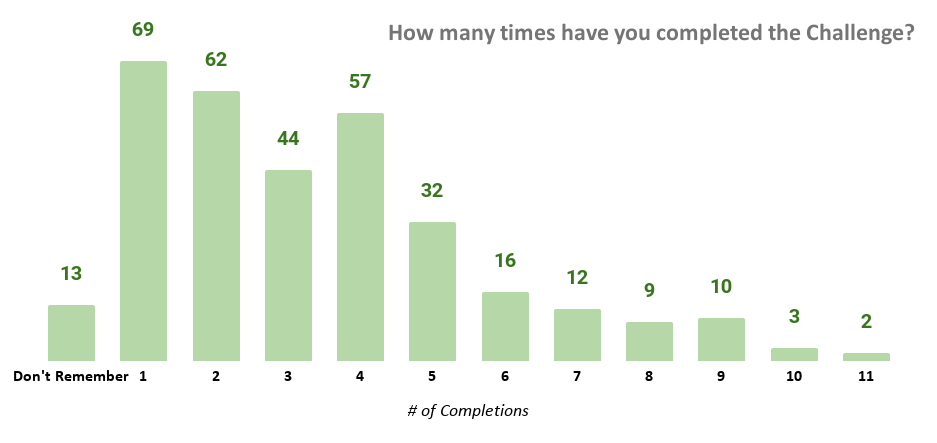
Looking at just the riders with 1, 2, or 3 years of completing these fall festivities, this group makes up more than 50% of all the riders this year. Hopefully they continue to find the experience joyful and keep their streaks alive!
5 people have ridden 10 or more times which is hugely impressive! And there’s another batch of 10 riders who made it 9 years – maybe they can celebrate a milestone in 2022 if they finish on time!
Where are you riding?
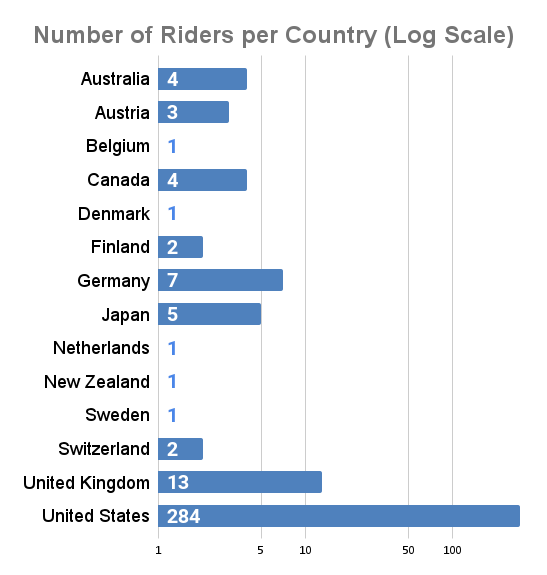
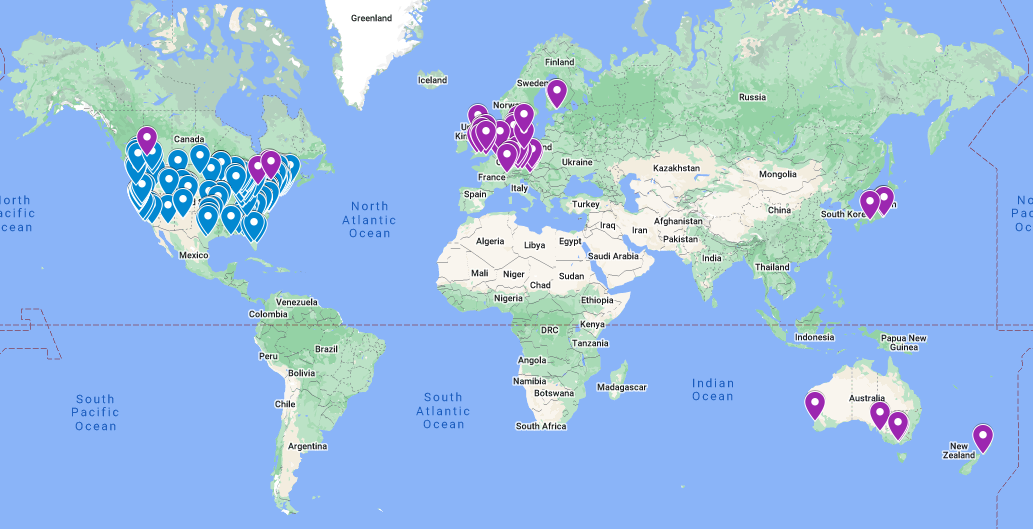
14 countries make it into the stats this year, and as usual the United States represents heavily with 86% of all riders. A new entrant brings New Zealand onto the chart for the first time! That makes 5 countries represented by a single rider, with 2 more countries showing up with 2 riders each. (The chart is a log scale, so check the horizontal axis before comparing countries.)
I took all the unique postal codes from rider submissions and created a quick Google Map that shows everyone’s home base. It’s really fun to see how spread out everyone is and also very quickly shows all the different types of areas people are participating from. I have enjoyed being a digital tourist in your areas, imagining myself riding between coffee shops and other interesting things that show up on the satellite images!
View the interactive map! US postal areas are blue markers, International spots are purple!
Digging into the U.S. Statistics
With so many participants from the United States, there is also more data to look at. So let’s see some quick numbers of what was represented this year:
- 42 states (including D.C.)
- 182 cities (including Albany, Georgia, and Albany, New York, which I didn’t realize until writing this section!)
- 232 zip codes (which is 0.56% of all 42 thousand U.S. zip codes!)
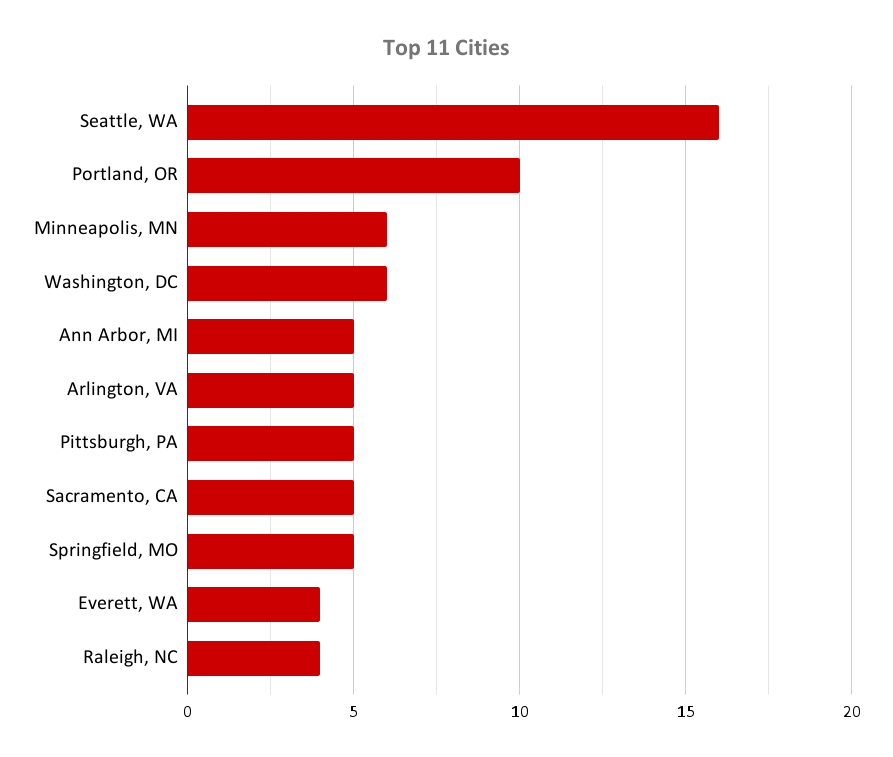
The chart below shows the top 11 cities for riders, with Ann Arbor, Springfield, and Everett showing up, placing quite high considering their smaller city populations. Overall a good mix of different cities across the country!
I was curious about large city representation, so I pulled up the latest Census data for the “50 Largest U.S. Cities.” From the list, only 24 of the largest cities had riders participate. And of the top 10 cities, only 3 had riders (New York, Los Angeles, San Antonio)! Big cities are missing out on the fun – although 7 of the top 10 are in warmer climates, so maybe they don’t need the fall drink warmup!

I might have to dig deeper and consider how including metro areas changes this. Or maybe see if challenge participants are more likely to reside in population-dense areas or not.
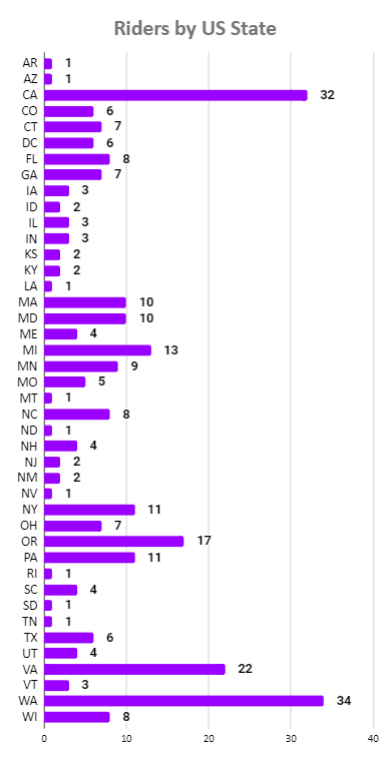
Until then, here’s a heatmap of which states riders were in! States with no finishers are gray, and the map helps us see the stripe through the center of the country that might need some encouragement.
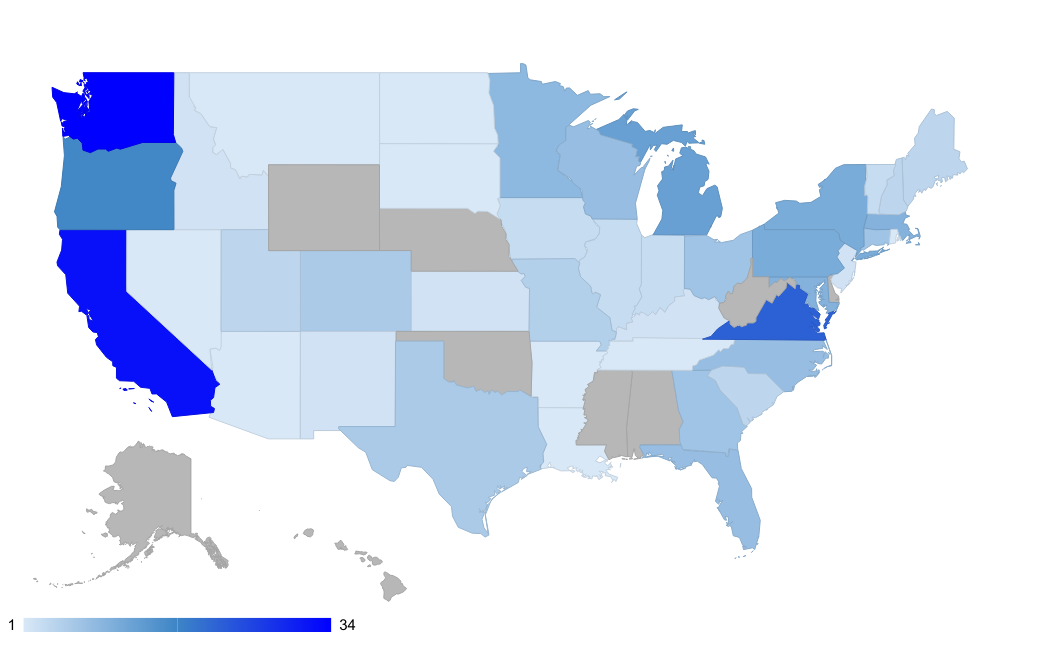
If you want the numbers, here’s a chart of all 42 states and their counts.
Until Next Time
That concludes most of the major statistics about who rode and where they are located, and there are still a handful of other things I’d like to dig into and talk about, but those will have to wait for another post. But I’ll leave you with these four data points:
- Three people (including myself) favored Dirty Chai lattes on our trips (which is less than the 7 people who preferred Decaf!).
- One-third of the participants used Facebook to track ride information.
- Total Miles Ridden: 39,067 mi (or 62886 km)
- Furthest total distance reported by a rider: 738 miles! (It was over 9 rides, but still!)
Thank you, Sam, an A+ summary! Readers, any other burning questions you have about coffeeneuring? Send them our way and we’ll see if we have answers. And thank you again, Sam, for the awesome summary of 2021 and beyond!

Comments welcome. Keep it civil, por favor!